"Where does all my money go?" It's the question everyone asks at the end of the month. You earned a decent income, but somehow your bank account tells a different story.
Traditional budget tracking gives you numbers in spreadsheets. Pie charts show percentages. But neither truly captures how money flows through your finances - from income sources, through your budget, into different expense categories. You might also find the 50/30/20 budget rule helpful for structuring your spending.
Enter the Sankey diagram: a visual representation that shows exactly where your money goes, with the width of each flow proportional to its amount. One glance and you understand your entire financial picture.
What Is a Sankey Diagram? (And Why It's Perfect for Budgeting)
A Sankey diagram is a flow visualization where arrows connect sources to destinations, with the arrow width representing the magnitude of flow. The thicker the line, the more money.
The diagram is named after Irish Captain Matthew Sankey, who used this visualization in 1898 to show energy efficiency in steam engines. Today, it's used everywhere from energy analysis to website traffic - and increasingly for personal finance.
For budgeting, a Sankey diagram answers the question "how to visualize where my money goes" better than any other chart:
- Income sources appear on the left (salary, freelance, bonuses)
- Your total budget forms the central node
- Expense categories branch out on the right (housing, groceries, entertainment)
- Flow widths show relative amounts at a glance
How to See Where Your Money Goes - Visually
Traditional pie charts have a problem: they only show distribution at one point. A Sankey diagram shows the complete journey of your money.
Consider this comparison:
| Pie Chart | Sankey Diagram |
|---|---|
| Shows expense breakdown | Shows income AND expense flow |
| Hard to compare similar slices | Width makes comparison easy |
| No flow or direction | Clear left-to-right flow |
| Difficult with many categories | Handles 10+ categories elegantly |
When you track income and expenses visually with a Sankey diagram, patterns become obvious. That "small" subscription spending suddenly looks significant when you see its flow compared to your grocery budget.
Create Your Cash Flow Diagram in GoodShare
Creating a budget flow chart used to require Excel wizardry or expensive software. GoodShare makes it automatic - your Sankey diagram generates from your actual transactions.
Here's how it works:
- Track your transactions: Add income and expenses to GoodShare as you normally would. Each transaction gets categorized.
- Open the Sankey view: In your budget book, tap the chart icon and select "Cash Flow Diagram".
- Choose your time period: View this month, last 3 months, 6 months, or custom dates.
- Explore your flow: The diagram generates automatically, showing your complete money flow.
Want to try it right now? Use our free online Sankey diagram tool to create a quick cash flow visualization - no download required.

How to Read and Interpret Your Money Flow Chart
Let's decode a typical Sankey diagram for personal finance:
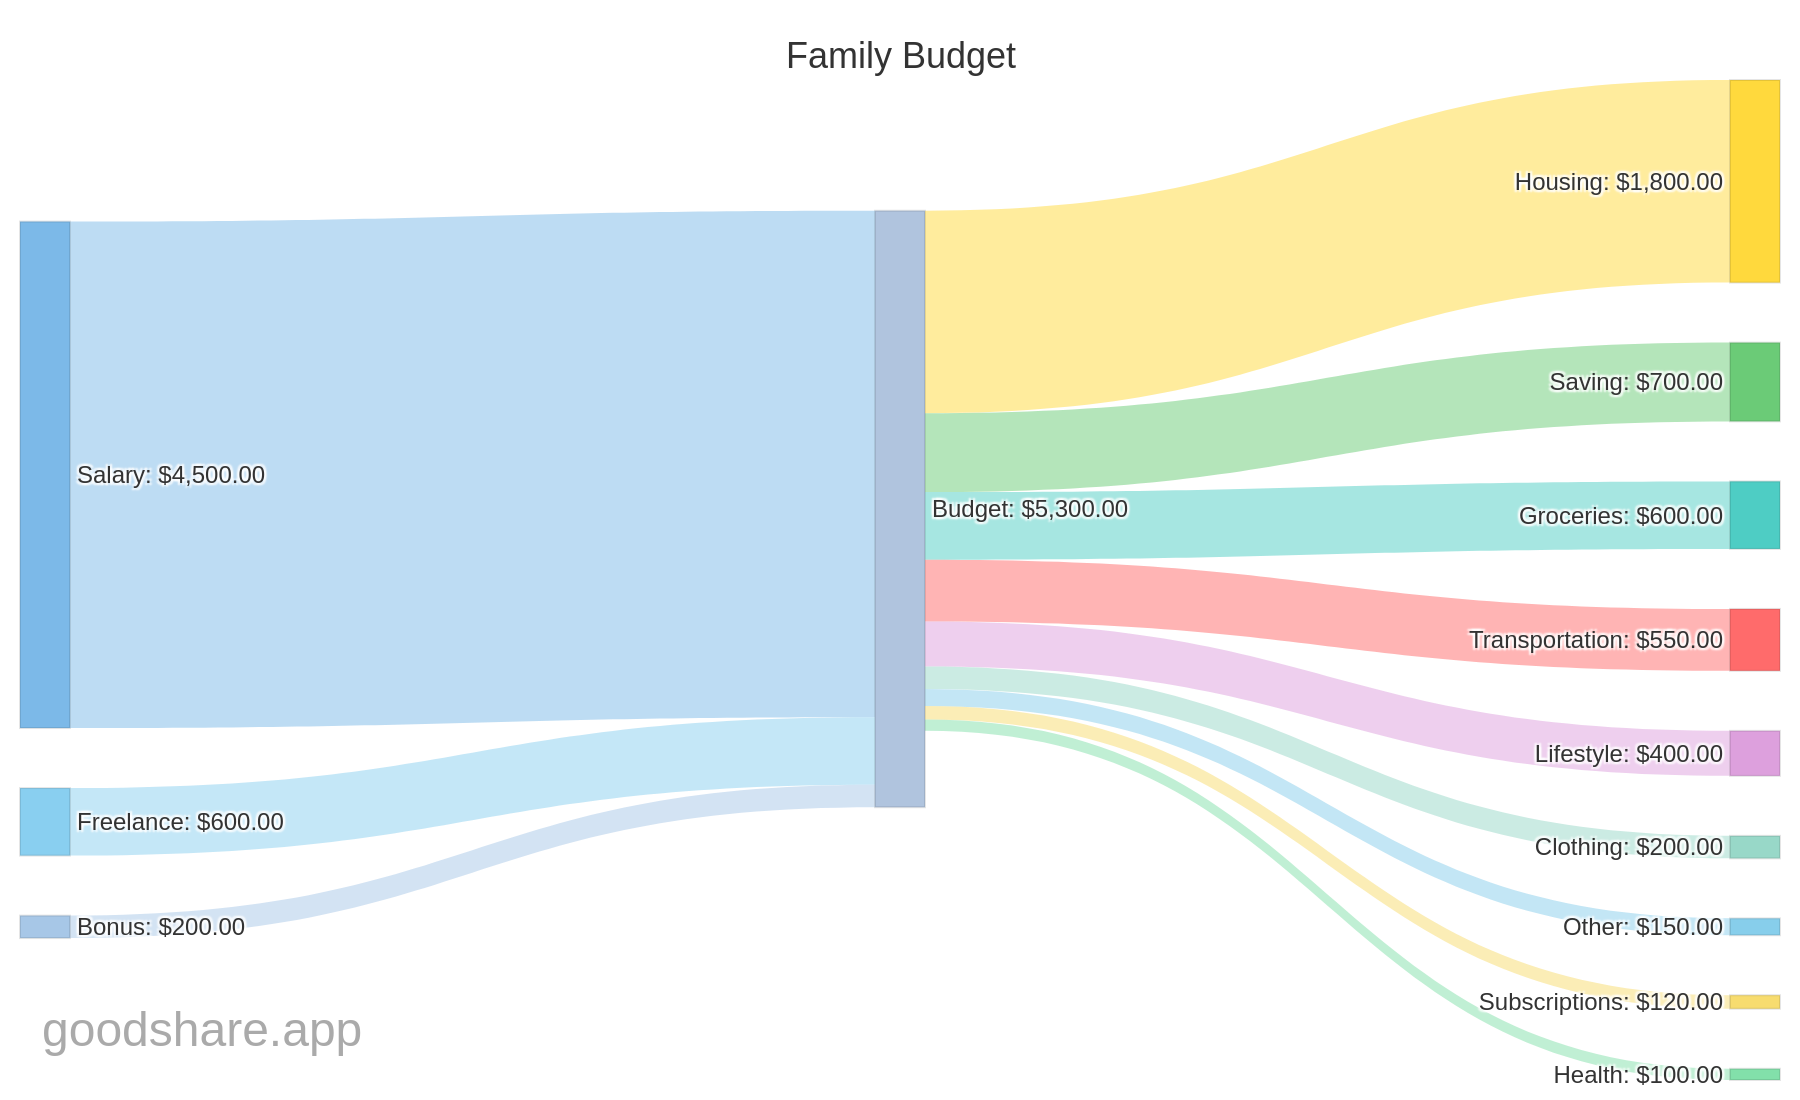
Left side - Income sources: These are where your money comes from. In this example, you can see Salary as the main income, with smaller streams from Freelance work and a Bonus. The widths immediately show which income source contributes most.
Center - Budget total: All income flows merge into your total budget. This single node represents everything you have to work with for the period.
Right side - Expense categories: Money flows out to various categories. Wider flows mean higher spending. In a healthy budget, you'll also see a flow to "Savings" - money that doesn't leave.
Compare flow widths visually. Is your entertainment spending wider than your savings flow? Is housing dominating everything else? The diagram makes these imbalances obvious - no math required.
Understanding the colors
Each category gets a unique color, making it easy to follow flows across the diagram. Income sources typically appear in cool colors (blue, teal), while expense categories use a variety of colors for distinction.
The color coding helps when you have many categories - you can instantly trace where a specific income stream ends up or which expenses are consuming the most.
Download, Share, and Track Your Budget Visualization
A Sankey diagram isn't just for personal insight. GoodShare lets you:
- Download as PNG: Save the diagram as an image. Perfect for including in documents, presentations, or your own records.
- Share with your partner: If you're tracking finances together, share the visualization so you're both on the same page about where money goes.
- Show your financial advisor: A visual summary often communicates more than pages of transactions.
- Track month over month: Save diagrams from different periods to see how your money flow changes over time.
Why Cash Flow Visualization Matters for Couples
For couples managing money together, the Sankey diagram becomes even more powerful. Both partners can see:
- How both incomes contribute to the household budget
- Which spending categories dominate your shared finances
- Whether you're actually saving as much as you planned
- Where to cut back if you want to reach goals faster
Instead of arguing about who spends more, you have an objective visualization. The diagram doesn't lie - it just shows the flow. Couples can benefit from our complete budget guide for couples.
Why Sankey Diagrams Are the Best Budget Visualization
A Sankey diagram transforms abstract numbers into intuitive visual understanding. Instead of scrolling through transaction lists or puzzling over pie charts, you see exactly where your money goes - from source to destination.
The best budget visualization app 2026 isn't one that just tracks numbers. It's one that helps you actually understand your finances. And understanding is the first step to improvement.
"You can't manage what you can't measure - and you can't improve what you can't visualize."
Try our free calculator
Use our free Cash Flow Diagram Tool to create your own interactive Sankey chart and visualize where your money goes.
Frequently Asked Questions
What is a Sankey diagram?
A Sankey diagram is a flow visualization where the width of each arrow represents the size of a value. For budgeting, it shows how your income flows into different expense categories, making it easy to spot where most of your money goes.
How do I create a budget flow chart?
Start by listing your income sources and expense categories. Track your spending for at least one month, then use a tool like GoodShare to automatically generate a Sankey cash flow diagram from your data.
What is the best budget visualization app?
The best budget visualization app should automatically categorize expenses and generate visual reports. GoodShare creates Sankey diagrams from your tracked expenses, giving you an instant overview of your money flow.
Can I create a Sankey diagram online for free?
Yes! GoodShare offers a free online Sankey diagram tool where you can enter your income and expenses to instantly generate an interactive cash flow visualization. No registration or download required.
Sankey diagram vs. pie chart: what is the difference?
A pie chart shows the proportional breakdown of a single total (e.g., how your expenses split across categories). A Sankey diagram goes further by showing the directional flow of money from income through your budget into expense categories. This makes it easier to trace where every dollar goes and identify the largest money flows at a glance.
Try Sankey Diagrams in GoodShare
Visualize your cash flow with GoodShare Pro. Download your money flow as an image or share with your partner.
Download GoodShare Try Free Online Tool